In MyNetworkmap you can visualize the collected network data during or after a running online survey.
The following text explains how to do this with the help of an example.
First, please create an empty network map with the module "Network map visualization".
Afterwards please switch to the module "Survey Results".
Survey Results
Select the questionnaire whose interviews you want to visualize ("Load questionnaire"):
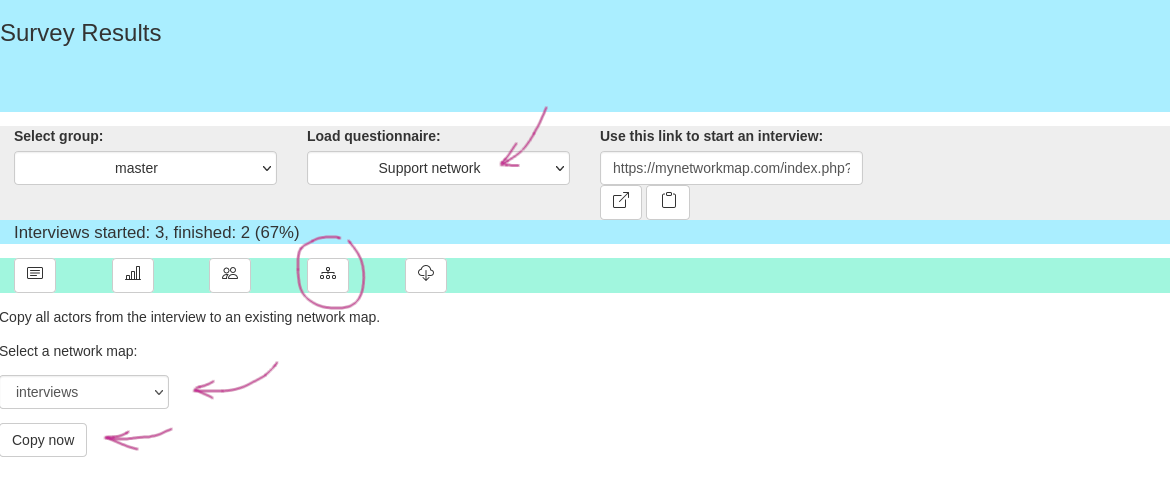
Then click the fourth button from the right:

Then select the network map on which the interviews (all egos, alteri, relations) are to be visualized.
Then click on "Copy now".
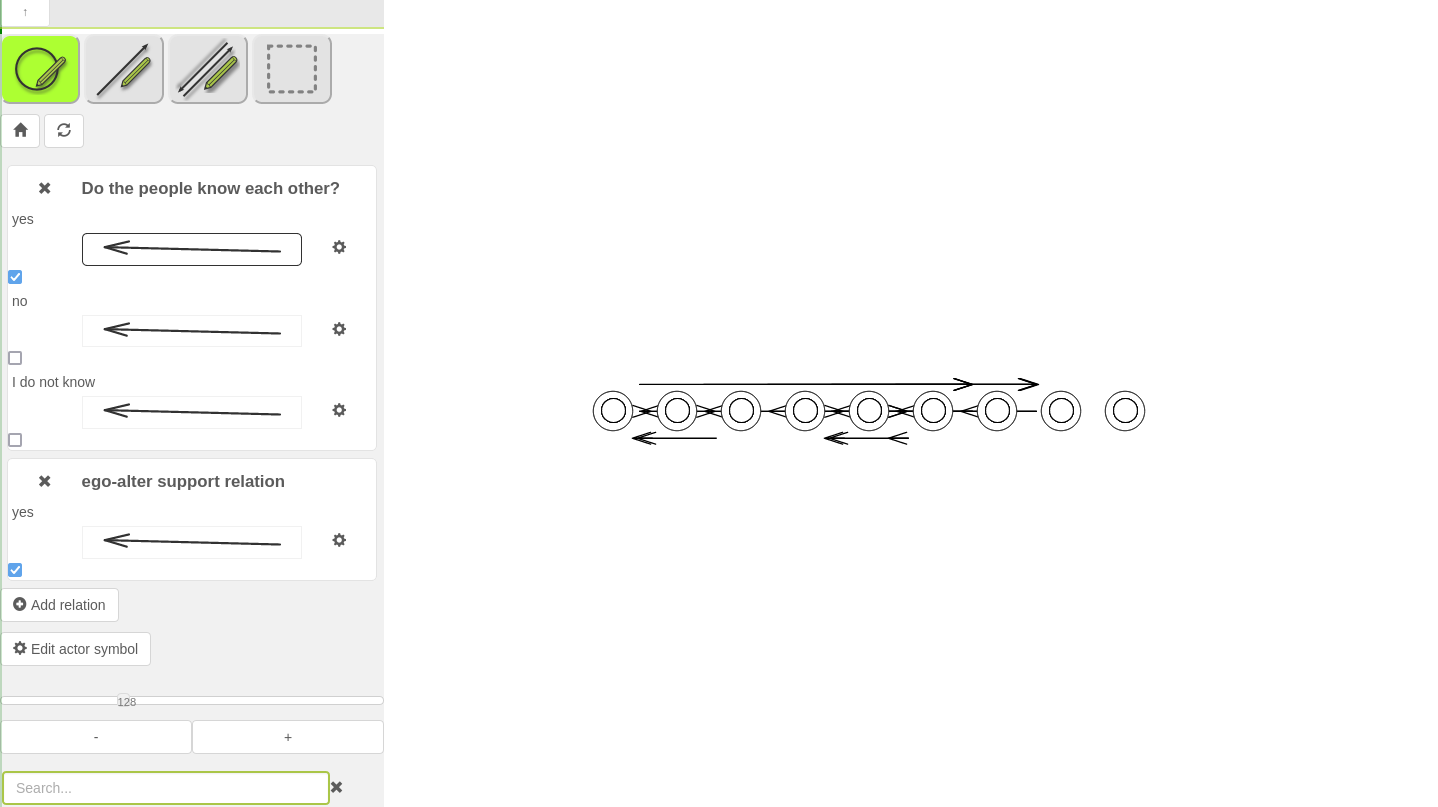
Now switch to the "Network map visualization" module.
Network map visualization
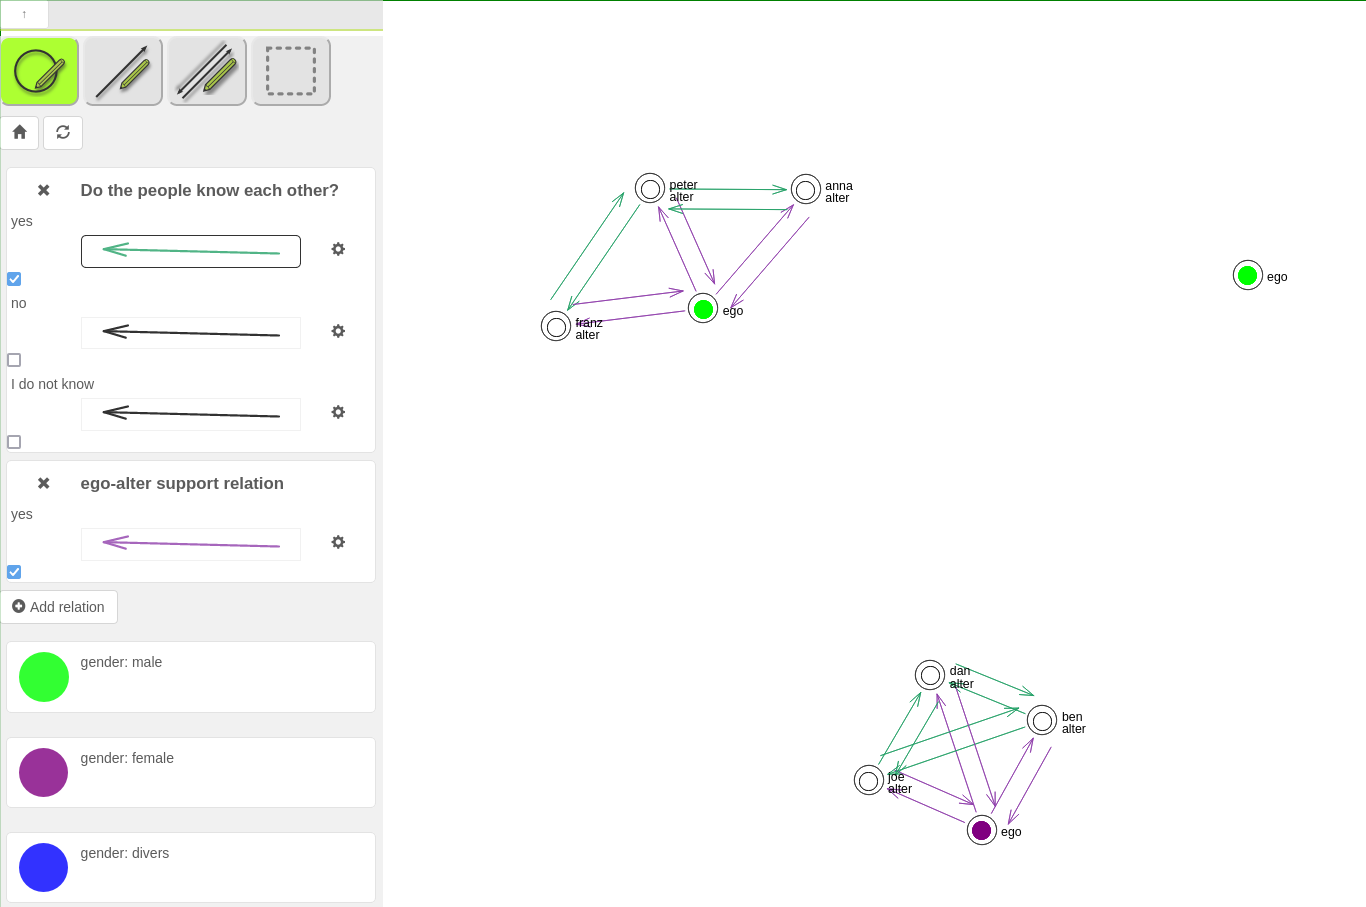
Here you can now see all the actors who were interviewed (egos and alteris):
Here is an example:
You can run a layout algorithm to place the alteri near to the ego. To do this, go to the "Analysis" section in the side menu. Enter the value 20 in the line "Layout (Fruchterman Reingold)" and then click on "start...". After a short calculation your visualization should look like this:
You can also add the actor label. To do this, go to the "Visualization" section in the side menu and click "Edit..." in the "Actor label" line. Then select an attribute (e.g. the attribute that contains the actor name (if you have collected something like that in your interview)). Then click on "Save". Now the actor names should be displayed.
Further network visualization settings and how to do them can be found in the documentation, e.g. here: https://docs.kronenwett-adolphs.com/networkmap-menu